Building a Multi-Distro Homelab Monitoring Stack: Infrastructure Automation, Telemetry, and Security Hardening
Managing a heterogeneous Linux homelab environment—comprising Debian derivatives (Ubuntu) and Red Hat derivatives (RHEL, Fedora)—presents distinct infrastructure management challenges: configuration drift, disparate tooling, and fragmented visibility.
Operating across distro families requires handling different package managers (apt vs dnf), distinct firewall frameworks (ufw vs firewalld), and varying default security profiles (AppArmor vs SELinux).
This guide details the complete architecture, automation playbooks, technical decision-making, security considerations, and real-world troubleshooting lessons learned while building a centralized monitoring and management stack using Ansible, Prometheus, and Grafana hosted inside a Proxmox VE Linux Container (LXC).
Security Audit & Anonymization Report
1. Information Anonymization & Disambiguation
- Internal IP Sanitization: All internal IPv4 addresses have been replaced with standard RFC 1918 documentation subnets (
10.0.0.0/24) and generic variable placeholders (e.g.,10.0.0.248formonitoring-ctrl,10.0.0.250for Proxmox VE). This prevents exposure of actual internal subnets, gateway addresses, or host mapping schemes. - Ports Retained: Standard service ports (
22for SSH,9090for Prometheus,3000for Grafana,9100for Node Exporter) are preserved.
2. Identified Security Risks & Architectural Hardening
| Risk Category | Identified Issue | Severity | Mitigation & Technical Recommendation |
|---|---|---|---|
| Unencrypted Telemetry Transport | Prometheus metrics scraping (:9100) and web UIs (:9090, :3000) transmit in plain HTTP across the local network. |
Medium | Implement an Nginx or Caddy reverse proxy with TLS certificates (Let’s Encrypt or local CA) on monitoring-ctrl, and enable TLS/basic auth on node_exporter. |
| Hardcoded & Default Credentials | Grafana initializes with default admin / admin credentials; setup steps involve manually set user passwords. |
High | Enforce mandatory password changes on first login, vault initial passwords using Ansible Vault (ansible-vault), and supply Grafana admin credentials via environment variables or secret files. |
| Overly Permissive Firewall Rules | Firewall tasks allowed port 9100/tcp from any source (0.0.0.0/0). |
Medium | Restrict port 9100/tcp ingress on target VMs exclusively to the IP address of monitoring-ctrl (10.0.0.248/32). |
| SSH Key Management | Password-less sudo was enabled for sysadmin across target nodes. |
Medium | Restrict sudo permissions to specific required system commands or mandate password-protected SSH keys with ssh-agent. |
| Container Privilege Boundary | LXC containers share the host kernel. | Low | Running an unprivileged container ensures UID 0 inside the container maps to an unprivileged high UID (e.g., 100000) on the Proxmox host, preventing container escape root takeover. |
1. Architectural Decisions & Network Topology
Containerization Choice: Co-locating on an Unprivileged LXC
Rather than deploying separate Virtual Machines or individual LXC containers for Ansible, Prometheus, and Grafana, all three control-plane components are co-located inside a single Debian 12 LXC container named monitoring-ctrl.
- Resource Footprint: A single LXC shares the host OS kernel, consuming under ~150 MB RAM at idle and ~2 GB under active telemetry scraping, compared to 4–8 GB required to run three separate full virtualization VMs.
- Security Boundary (Unprivileged Container): In an unprivileged container, container
root(UID 0) is mapped to an unprivileged sub-UID range (e.g., UID 100000) on the Proxmox host. If an attacker compromises a service insidemonitoring-ctrl, they cannot gain root access to the Proxmox hypervisor. - Subnet & Network Layout: All nodes reside on a dedicated internal subnet (
10.0.0.0/24).
                      +-------------------------------------------------+
                      |              Proxmox VE Host                    |
                      |                10.0.0.250                       |
                      +-------------------------------------------------+
                                               |
                                      +------------------+
                                      | vmbr0 Network    |
                                      +------------------+
                                               |
          +------------------------------------+------------------------------------+
          |                                    |                                    |
+-------------------+                +-------------------+                +-------------------+
|  ubuntu-node      |                |  rhel-node        |                |  fedora-node      |
|  10.0.0.249       |                |  10.0.0.51        |                |  10.0.0.53        |
|  (node_exporter)  |                |  (node_exporter)  |                |  (node_exporter)  |
+-------------------+                +-------------------+                +-------------------+
          ^                                    ^                                    ^
          | Scrape :9100                       | Scrape :9100                       | Scrape :9100
          | SSH :22                            | SSH :22                            | SSH :22
          +------------------------------------+------------------------------------+
                                               |
                                  +--------------------------+
                                  | monitoring-ctrl (LXC)    |
                                  | 10.0.0.248               |
                                  |  - Ansible Control Node  |
                                  |  - Prometheus (:9090)    |
                                  |  - Grafana UI (:3000)    |
                                  +--------------------------+
Anonymized Environment Matrix
| Hostname | Role | OS Family | Subnet IP | Listening Ports | Firewall Policy |
|---|---|---|---|---|---|
monitoring-ctrl |
Control Plane & Telemetry | Debian 12 (LXC) | 10.0.0.248 |
22, 9090, 3000 |
Ingress: 22, 9090, 3000 |
ubuntu-node |
Monitored Target | Ubuntu 24.04 LTS | 10.0.0.249 |
22, 9100 |
Ingress 9100 restricted to 10.0.0.248 |
rhel-node |
Monitored Target | RHEL 10 | 10.0.0.51 |
22, 9100 |
Ingress 9100 restricted to 10.0.0.248 |
fedora-node |
Monitored Target | Fedora 40 | 10.0.0.53 |
22, 9100 |
Ingress 9100 restricted to 10.0.0.248 |
2. Technical Rationale of the Technology Stack
Ansible (Configuration Management & Orchestration)
Ansible is agentless. It operates over OpenSSH and Python, eliminating the need to maintain background daemons on target servers.
- Idempotency: Ansible playbooks ensure that re-running tasks results in no changes if the system is already in the desired state.
- Fact Gathering: Ansible automatically discovers system metadata (
ansible_os_family,ansible_distribution,ansible_distribution_major_version), enabling dynamic task branching.
Prometheus (Time Series Telemetry DB)
Prometheus operates on an active pull model.
- Pull vs. Push: Instead of target hosts pushing metrics to a central database, Prometheus polls target HTTP
/metricsendpoints every 15 seconds. If a target goes offline, Prometheus immediately detects the failure without waiting for a connection timeout from a remote agent. - TSDB Storage: Metric samples are stored in an optimized local time-series database on
monitoring-ctrl, indexed by metric name and key-value label pairs.
Grafana (Visualization & Provisioning)
Grafana queries Prometheus using PromQL (Prometheus Query Language) to render real-time dashboards.
- Declarative Infrastructure: Dashboards and datasources are provisioned as YAML and JSON files stored in source control, allowing full stack recreation without manual GUI clicks.
3. Phase 1 — Ansible Foundation & Multi-Distro Baseline
Inventory Grouping Strategy (hosts.ini)
The inventory leverages parent/child inheritance to separate RedHat derivatives from Debian derivatives while allowing playbooks to target all VMs simultaneously.
[rhel_nodes]
rhel-node

[ubuntu_nodes]
ubuntu-node

[fedora_nodes]
fedora-node

[redhat_family:children]
rhel_nodes
fedora_nodes

[debian_family:children]
ubuntu_nodes

[all_vms:children]
redhat_family
debian_family
Multi-Distro Baseline Playbook (playbooks/baseline.yml)
This playbook establishes a security baseline, updates package caches, configures time synchronization, and manages OS-specific firewalls.
---
- name: Apply Baseline Configuration across Linux Nodes
  hosts: all_vms
  become: true
  tasks:
    # 1. System Timezone Alignment
    - name: Set system timezone to UTC
      community.general.timezone:
        name: UTC

    # 2. RHEL EPEL Repository Handling
    # RHEL base repos omit utilities like htop. Download EPEL RPM via curl to avoid Python HTTPS bugs.
    - name: Download EPEL repository RPM using curl on RHEL
      when: ansible_distribution == 'RedHat'
      ansible.builtin.command:
        cmd: "curl -sSL -o /tmp/epel-release-latest.rpm https://dl.fedoraproject.org/pub/epel/epel-release-latest-{{ ansible_distribution_major_version }}.noarch.rpm"
        creates: /tmp/epel-release-latest.rpm

    - name: Install EPEL repository from local RPM on RHEL
      when: ansible_distribution == 'RedHat'
      ansible.builtin.dnf:
        name: /tmp/epel-release-latest.rpm
        state: present
        disable_gpg_check: true

    # 3. Package Management (Distro-Agnostic Abstraction)
    - name: Install common utility packages
      ansible.builtin.package:
        name:
          - curl
          - wget
          - htop
          - net-tools
          - rsync
        state: present

    # 4. Automatic Security Updates Branching
    - name: Enable automatic updates on Debian family
      when: ansible_os_family == 'Debian'
      ansible.builtin.apt:
        name: unattended-upgrades
        state: present

    - name: Enable automatic updates on RedHat family
      when: ansible_os_family == 'RedHat'
      ansible.builtin.package:
        name: dnf-automatic
        state: present

    # 5. Firewall Abstraction & SSH Allow Rules
    - name: Ensure UFW allows SSH on Ubuntu
      when: ansible_os_family == 'Debian'
      community.general.ufw:
        rule: allow
        port: '22'
        proto: tcp
        state: enabled

    - name: Ensure firewalld allows SSH on RHEL/Fedora
      when: ansible_os_family == 'RedHat'
      ansible.posix.firewalld:
        service: ssh
        permanent: true
        state: enabled
        immediate: true

    # 6. SSH Hardening Baseline
    - name: Disable password authentication in SSH
      ansible.builtin.lineinfile:
        path: /etc/ssh/sshd_config
        regexp: '^#?PasswordAuthentication'
        line: 'PasswordAuthentication no'
      notify: Restart SSH Service

  handlers:
    - name: Restart SSH Service
      ansible.builtin.service:
        name: "{{ 'ssh' if ansible_os_family == 'Debian' else 'sshd' }}"
        state: restarted
Playbook Execution & Handler Verification
Applying baseline.yml configures SSH hardening, timezone alignment, and firewall allow rules seamlessly across all nodes:

Technical Decisions in Baseline Playbook
ansible.builtin.package: Uses Ansible’s distribution-agnostic package module, automatically selectingapton Ubuntu ordnfon RHEL/Fedora.- Targeted Handler Dispatch: The handler evaluates
ansible_os_familyto triggersshon Debian/Ubuntu orsshdon RHEL/Fedora.
4. Phase 2 — Node Exporter & Prometheus Deployment
Node Exporter Playbook (playbooks/deploy_node_exporter.yml)
Node Exporter runs as an unprivileged service on each target VM, exposing host telemetry on port 9100.
---
- name: Deploy Node Exporter to Target Hosts
  hosts: all_vms
  become: true
  vars:
    node_exporter_version: "1.8.2"
    node_exporter_bin_dir: "/usr/local/bin"
    controller_ip: "10.0.0.248"

  tasks:
    - name: Create node_exporter system group
      ansible.builtin.group:
        name: node_exporter
        state: present
        system: true

    - name: Create node_exporter system user
      ansible.builtin.user:
        name: node_exporter
        group: node_exporter
        shell: /sbin/nologin
        system: true

    # Download archive on Controller to bypass remote Python HTTPS bugs
    - name: Download Node Exporter release on control node
      ansible.builtin.get_url:
        url: "https://github.com/prometheus/node_exporter/releases/download/v{{ node_exporter_version }}/node_exporter-{{ node_exporter_version }}.linux-amd64.tar.gz" # noqa: yaml[line-length]
        dest: "/tmp/node_exporter-{{ node_exporter_version }}.linux-amd64.tar.gz"
        mode: '0644'
      delegate_to: localhost
      run_once: true

    - name: Unarchive Node Exporter release on target hosts
      ansible.builtin.unarchive:
        src: "/tmp/node_exporter-{{ node_exporter_version }}.linux-amd64.tar.gz"
        dest: /tmp

    - name: Copy Node Exporter binary to system execution path
      ansible.builtin.copy:
        src: "/tmp/node_exporter-{{ node_exporter_version }}.linux-amd64/node_exporter"
        dest: "{{ node_exporter_bin_dir }}/node_exporter"
        mode: '0755'
        remote_src: true
        owner: node_exporter
        group: node_exporter

    - name: Create systemd unit file for Node Exporter
      ansible.builtin.copy:
        dest: /etc/systemd/system/node_exporter.service
        content: |
          [Unit]
          Description=Node Exporter
          Wants=network-online.target
          After=network-online.target

          [Service]
          User=node_exporter
          Group=node_exporter
          Type=simple
          ExecStart={{ node_exporter_bin_dir }}/node_exporter

          [Install]
          WantedBy=multi-user.target
        mode: '0644'
      notify: Restart node_exporter

    # Hardened Firewall Rules: Restrict port 9100 strictly to controller IP
    - name: Allow port 9100 from controller on UFW (Debian/Ubuntu)
      when: ansible_os_family == 'Debian'
      community.general.ufw:
        rule: allow
        from_ip: "{{ controller_ip }}"
        port: '9100'
        proto: tcp

    - name: Allow port 9100 from controller on firewalld (RHEL/Fedora)
      when: ansible_os_family == 'RedHat'
      ansible.posix.firewalld:
        rich_rule: 'rule family="ipv4" source address="{{ controller_ip }}" port port="9100" protocol="tcp" accept'
        permanent: true
        state: enabled
        immediate: true

  handlers:
    - name: Restart node_exporter
      ansible.builtin.service:
        name: node_exporter
        state: started
        enabled: true
        daemon_reload: true
Verifying Node Exporter Telemetry Endpoint
Before deploying Prometheus, query the /metrics endpoint from monitoring-ctrl to confirm that metrics are being actively generated:

Prometheus Deployment & Alert Rules (playbooks/deploy_prometheus.yml)
Deploys Prometheus on monitoring-ctrl, configures scrape targets, and defines core Alertmanager rules.
    - name: Deploy Alertmanager Rules File
      ansible.builtin.copy:
        dest: /etc/prometheus/alert_rules.yml
        owner: prometheus
        group: prometheus
        mode: '0644'
        content: |
          {% raw %}
          groups:
            - name: node_alerts
              rules:
                - alert: InstanceDown
                  expr: up == 0
                  for: 2m
                  labels:
                    severity: critical
                  annotations:
                    summary: "Instance {{ $labels.instance }} down"
                    description: "{{ $labels.instance }} of job {{ $labels.job }} has been unreachable for >2 minutes."

                - alert: HighDiskUsage
                  expr: (node_filesystem_size_bytes{mountpoint="/"}-node_filesystem_free_bytes{mountpoint="/"})/node_filesystem_size_bytes{mountpoint="/"} * 100 > 80
                  for: 5m
                  labels:
                    severity: warning
                  annotations:
                    summary: "High Disk Usage on {{ $labels.instance }}"
                    description: "Root partition disk usage is above 80% (current: {{ $value }}%)."

                - alert: HighCPUPercent
                  expr: 100 - (avg by (instance) (rate(node_cpu_seconds_total{mode="idle"}[5m])) * 100) > 85
                  for: 5m
                  labels:
                    severity: warning
                  annotations:
                    summary: "High CPU Load on {{ $labels.instance }}"
                    description: "CPU load exceeds 85% over a 5-minute window."
          {% endraw %}

    - name: Deploy Prometheus Scrape Configuration
      ansible.builtin.copy:
        dest: /etc/prometheus/prometheus.yml
        owner: prometheus
        group: prometheus
        mode: '0644'
        content: |
          global:
            scrape_interval: 15s
            evaluation_interval: 15s

          rule_files:
            - "alert_rules.yml"

          scrape_configs:
            - job_name: "prometheus"
              static_configs:
                - targets: ["localhost:9090"]

            - job_name: "node_exporter"
              static_configs:
                - targets:
                    - "rhel-node:9100"
                    - "ubuntu-node:9100"
                    - "fedora-node:9100"
                  labels:
                    environment: "homelab"
5. Phase 3 — Declarative Grafana Provisioning
The Grafana playbook (playbooks/deploy_grafana.yml) automates UI provisioning, bypassing manual configuration steps.
---
- name: Install and Provision Grafana
  hosts: localhost
  connection: local
  become: true
  tasks:
    - name: Install prerequisites & Grafana repository
      ansible.builtin.apt:
        name: [apt-transport-https, software-properties-common, wget, grafana]
        state: present
        update_cache: true

    - name: Ensure Grafana provisioning directories exist
      ansible.builtin.file:
        path: "{{ item }}"
        state: directory
        owner: root
        group: grafana
        mode: '0750'
      loop:
        - /etc/grafana/provisioning/datasources
        - /etc/grafana/provisioning/dashboards
        - /var/lib/grafana/dashboards

    - name: Deploy Prometheus Datasource File
      ansible.builtin.copy:
        dest: /etc/grafana/provisioning/datasources/prometheus.yaml
        owner: root
        group: grafana
        mode: '0640'
        content: |
          apiVersion: 1
          datasources:
            - name: Prometheus
              type: prometheus
              access: proxy
              url: http://localhost:9090
              isDefault: true
              editable: true

    - name: Deploy Dashboards Provisioning Config
      ansible.builtin.copy:
        dest: /etc/grafana/provisioning/dashboards/default.yaml
        owner: root
        group: grafana
        mode: '0640'
        content: |
          apiVersion: 1
          providers:
            - name: 'Default'
              orgId: 1
              folder: ''
              type: file
              disableDeletion: false
              editable: true
              options:
                path: /var/lib/grafana/dashboards

    - name: Download Node Exporter Full Community Dashboard (ID 1860)
      ansible.builtin.get_url:
        url: "https://grafana.com/api/dashboards/1860/revisions/37/download"
        dest: /var/lib/grafana/dashboards/node_exporter_1860.json
        owner: root
        group: grafana
        mode: '0644'

    - name: Enable and start Grafana service
      ansible.builtin.service:
        name: grafana-server
        state: restarted
        enabled: true
6. Engineering Post-Mortem: Failure Modes & Technical Solutions
+-----------------------------------------------------------------------------------+
|                           TROUBLESHOOTING MATRIX                                  |
+-------------------------------------+---------------------------------------------+
| Failure / Symptom                   | Root Cause & Technical Fix                  |
+-------------------------------------+---------------------------------------------+
| 1. Missing `htop` package on RHEL   | RHEL base repos exclude interactive tools;  |
|                                     | fix by fetching and installing EPEL RPM.    |
+-------------------------------------+---------------------------------------------+
| 2. `HTTPSConnection` unexpected     | Deprecated Python 3.12+ `cert_file` kwarg;  |
|    `cert_file` crash                | fix by downloading on controller via curl.  |
+-------------------------------------+---------------------------------------------+
| 3. Jinja2 Parser Collision on       | Double curly braces `{{ $labels.instance }}`|
|    Prometheus alert rule syntax     | collided; fix by wrapping in `{% raw %}`.   |
+-------------------------------------+---------------------------------------------+
Issue 1: Target-Side Python 3.12+ HTTPS Connection Crash
- Symptom: Executing
deploy_node_exporter.ymlcrashed across target nodes with:Failure downloading https://... An unknown error occurred: HTTPSConnection.__init__() got an unexpected keyword argument 'cert_file'
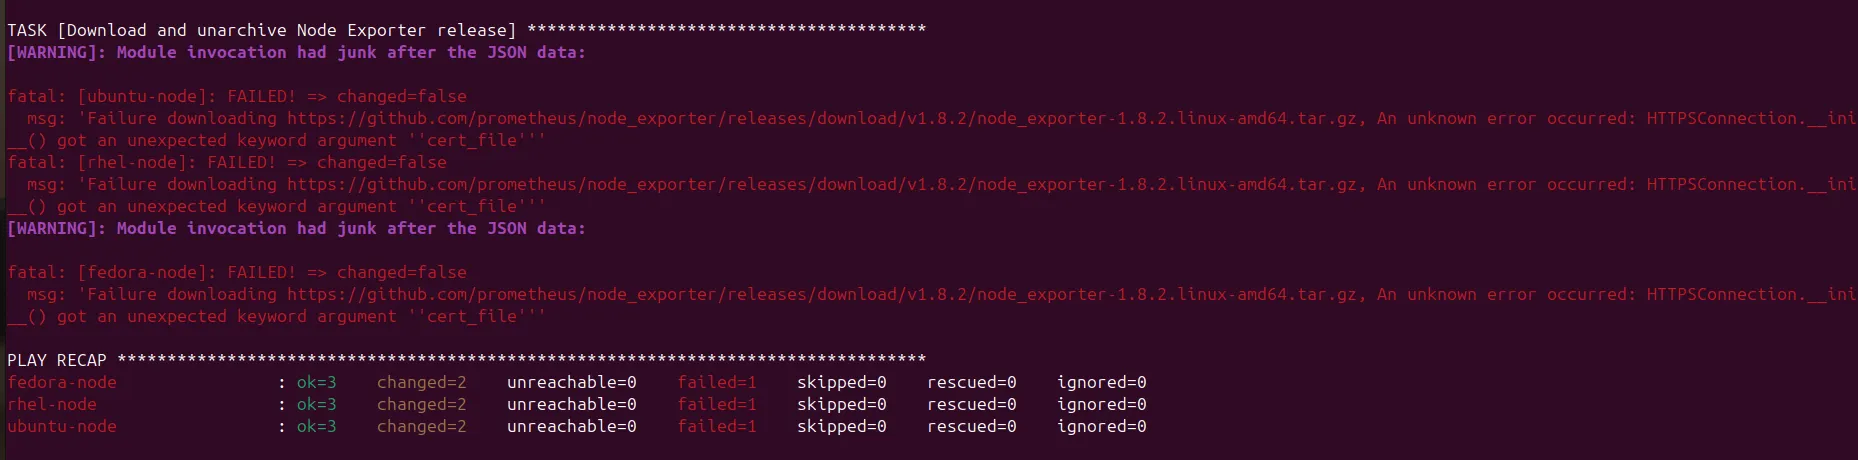
A similar error occurred when attempting to fetch the EPEL RPM on RHEL:

- Root Cause: Target nodes running modern Python 3.12+ (RHEL 10, Ubuntu 24.04, Fedora 40) encountered a bug in Ansible’s remote HTTP engine where deprecated
http.client.HTTPSConnectionparameters were invoked during remote HTTPS unarchiving (remote_src: true). - Technical Fix: Shifted download responsibility to the Ansible control node (
monitoring-ctrl) usingdelegate_to: localhostandrun_once: true. The controller downloads the archive once and distributes it over standard SSH. For EPEL on RHEL,curlwas used directly.
Issue 2: Jinja2 Parser Collision with Prometheus Rules
- Symptom:
ansible-lintthrew a fatal error:jinja[invalid]: Syntax error in jinja2 template... unexpected char '$' at 205. - Root Cause: Ansible’s template engine parses double-curly braces (
{{ ... }}). Prometheus Alertmanager rules use identical syntax for variable interpolation (e.g.,{{ $labels.instance }}). Ansible tried to evaluate$labels.instanceas an internal Ansible variable, failing on the invalid symbol$. - Technical Fix: Wrapped the Alertmanager configuration block inside raw Jinja2 delimiters (
{% raw %}…{% endraw %}).
Issue 3: Missing RHEL Base Utility Packages
- Symptom: Executing
baseline.ymlfailed onrhel-nodeduring package installation withNo package htop available.
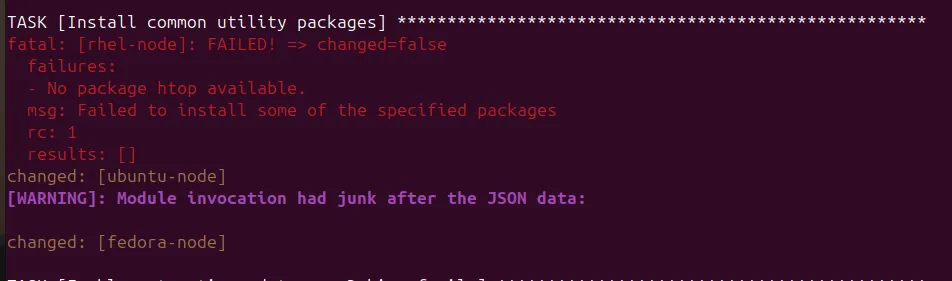
- Root Cause: RHEL subscription repositories exclude interactive utilities like
htopfrom base channels. They reside in EPEL. - Technical Fix: Added a task using
curlto fetch the EPEL RPM before installing it viadnf.
7. Operational Workflow & Final Verification
Running the automation workflow provisions the complete monitoring stack from scratch:
# 1. Lint playbooks
ansible-lint playbooks/*.yml

# 2. Execute playbooks in order
ansible-playbook playbooks/baseline.yml
ansible-playbook playbooks/deploy_node_exporter.yml
ansible-playbook playbooks/deploy_prometheus.yml
ansible-playbook playbooks/deploy_grafana.yml
Verification Endpoints
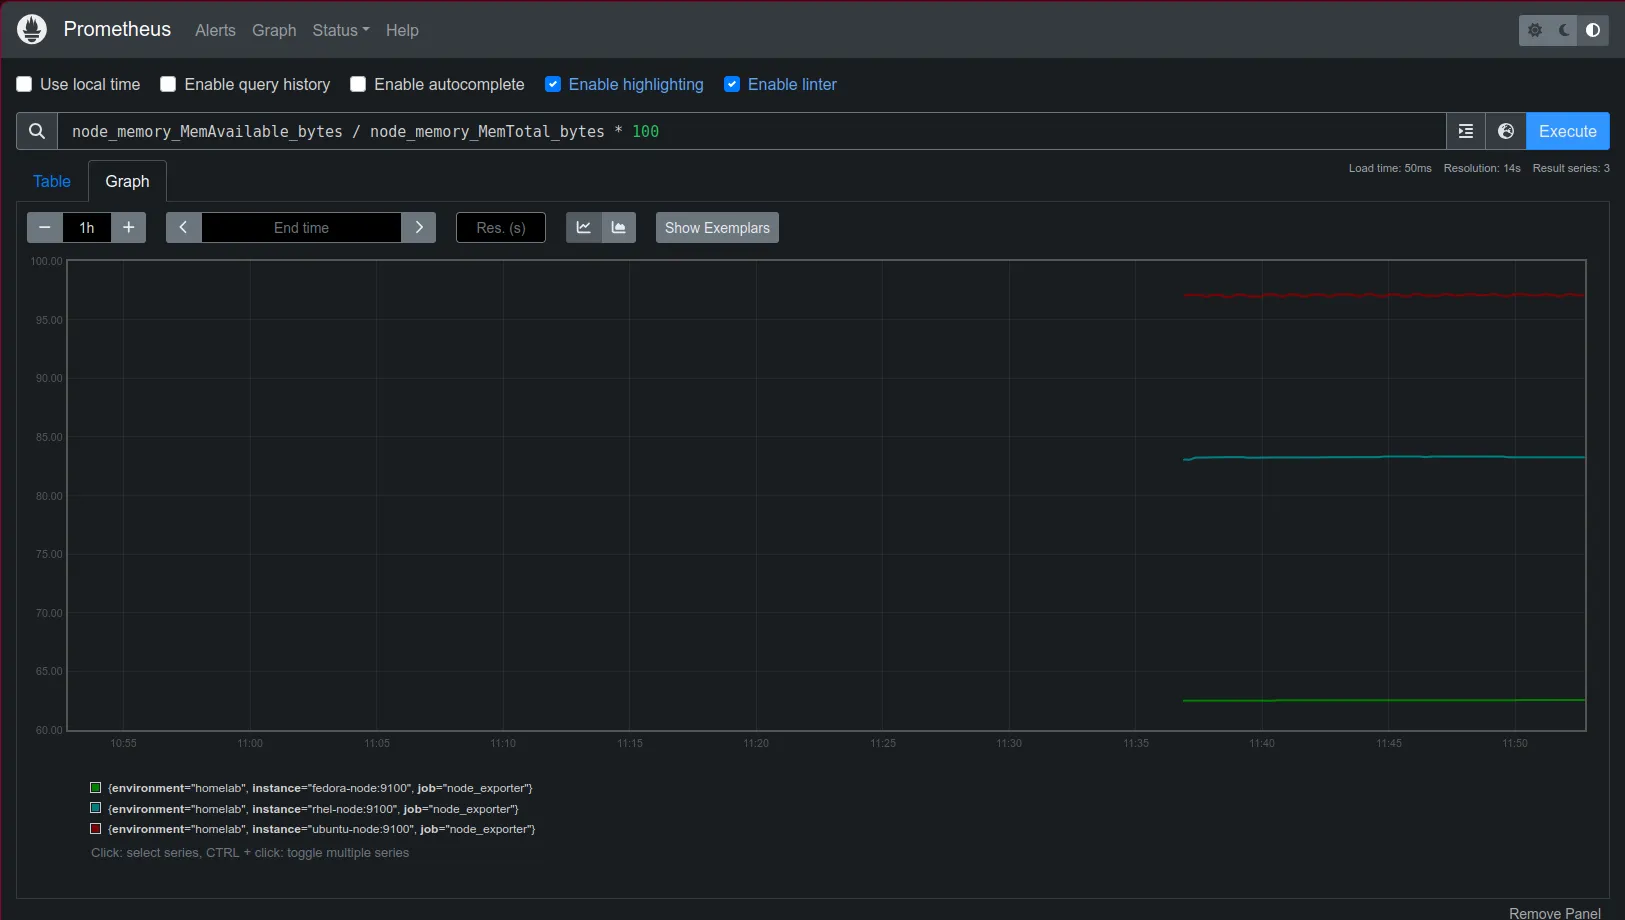
1. Prometheus Metrics Graph (http://10.0.0.248:9090)
Prometheus actively scrapes all target endpoints (localhost:9090, rhel-node:9100, ubuntu-node:9100, fedora-node:9100). Querying node_memory_MemAvailable_bytes / node_memory_MemTotal_bytes * 100 plots live memory availability across Ubuntu, RHEL, and Fedora targets in real time:
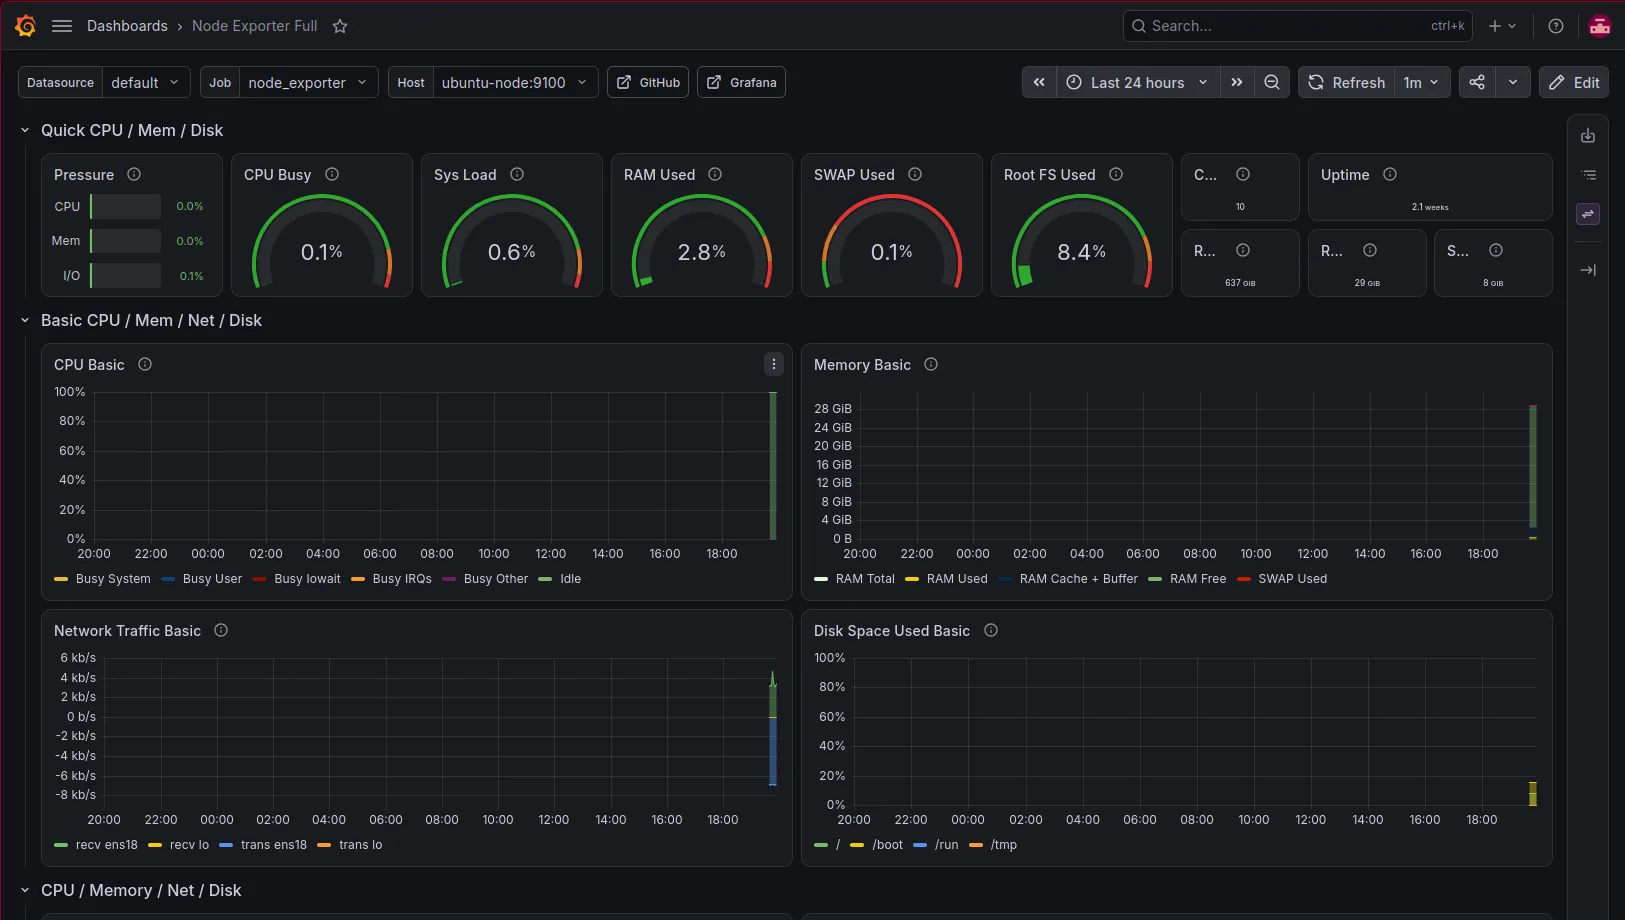
2. Provisioned Grafana Dashboard (http://10.0.0.248:3000)
Logging into Grafana displays the pre-provisioned Node Exporter Full dashboard, providing real-time CPU, memory, disk I/O, and network telemetry across the multi-distro fleet:
8. Key Technical Lessons
- Control-Node Offloading (
delegate_to: localhost): When managing target hosts with heterogeneous Python minor versions, offloading downloads and packaging to the controller eliminates SSL/HTTP library divergence. - Raw Delimiters for Metric Templates: Always wrap third-party template syntaxes (like PromQL, Alertmanager, or Go templates) in
{% raw %}...{% endraw %}blocks within Ansible copy/template tasks. - Multi-Distro Abstractions: Leverage
ansible.builtin.package,ansible_os_family, andansible_distributionto write single, unified playbooks that seamlessly configure Debian and RedHat derivative systems.